2D-Random Walk
Description of the problem
Yesterday I was looking at the deficit vs exchange rate curve. The curve suspiciously looks very similar to 2D-random walk. Today, I’ll sketch several 2D-random walk curves to see if I can get curves similar to what I had yesterday.
Theory
A discrete 1D-random walk is a sequence of real numbers \((x_n)\) such that
\[ \Delta x_n = x_n - x_{n-1} \sim
N(0,\epsilon) \]
for some \(\epsilon\). In a 2D-discrete random walk we have 2 of these sequences with possibly different \(\epsilon\)’s.
Code
Let us start with the libraries
from numpy.random import normal
from pandas import DataFrame as df
import matplotlib.pyplot as plt
I’ll implement the 1D-random walk. For 2D-random walk, I will call this function twice:
def randomWalk1D(n,epsilon=0.1,m=3):
    x = 0
    xs = []
    for i in range(n):
        x += normal(loc=0, scale=epsilon)
        xs.append(x)
    return df(xs).rolling(m).mean()
Let us plot:
xs = randomWalk1D(250, 0.2, 10)
ys = randomWalk1D(250, 0.2, 10)
plt.plot(xs,ys)
plt.savefig('2d-random-walk.png')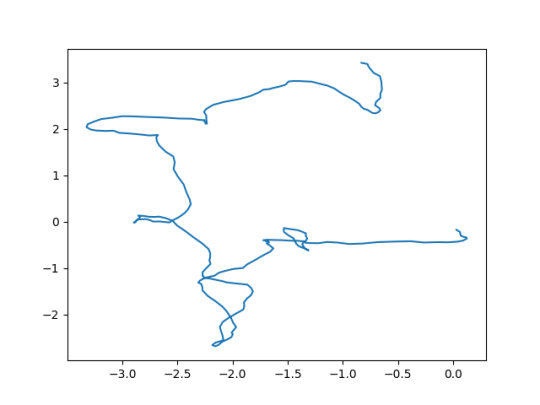
Analysis
Well… The curve I got yesterday looks very similar to these curves. So, really if there is a functional dependence between exchange rate and the trade deficit, it is not easy to see using a simple minded plot of these values against here.