Working with European Central Bank data in python (revisited)
Description of the problem
I have looked at pulling European Central Bank data using lisp, clojure, scala, and python. Today, I am going to revisit my python code and clean it up, and maybe, improve some.
Implementation
Let us start with the imports:
import json
import pandas as pd
from matplotlib import pyplot as plt
from urllib.request import urlopen
Next, our work-horse that will query ECB data warehouse:
def ecbProbe(dataset,name,m):
    mid = ':'.join(['0' for i in range(m)])
    base = 'https://sdw-wsrest.ecb.europa.eu/service/data/'
    with urlopen(f'{base}{dataset}?format=jsondata') as url:
         raw = json.load(url)

    dates = [x['name'] for x in raw['structure']['dimensions']['observation'][0]['values']]
    values = [x[0] for x in raw['dataSets'][0]['series'][mid]['observations'].values()]

    return pd.DataFrame({name: values}, index=dates)
There is a specific parameter that I couldn’t figure out. Each dataset has a specific key with specific number of ’0’s. So, I passed the number of these zeros as a parameter m.
Let us look at EU area trade deficit with China (imports divided by exports). For this dataset the parameter m is 8.
df1 = ecbProbe(f'ECB,TRD/M.I8.Y.M.TTT.CN.4.VAL','Imports',8)
df2 = ecbProbe(f'ECB,TRD/M.I8.Y.X.TTT.CN.4.VAL','Exports',8)

pd.DataFrame(df1['Imports']/df2['Exports']).plot(figsize=(12,6))
plt.savefig('ecb-with-python-trade-deficit.png')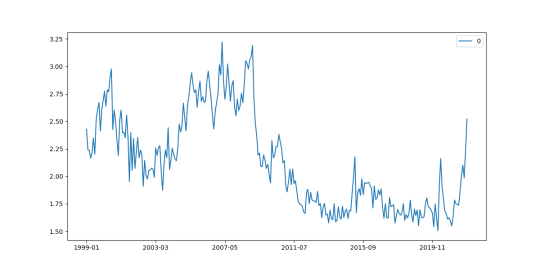
Next, we’ll get the consumer price index for the Euro area:
df = ecbProbe('ICP/M.U2.N.000000.4.ANR','CPI Euro Area',6)

df.plot(figsize=(12,6))
plt.savefig('ecb-with-python-cpi.png')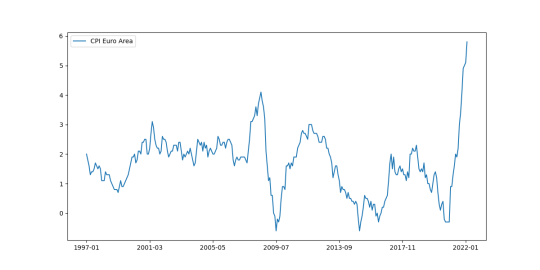
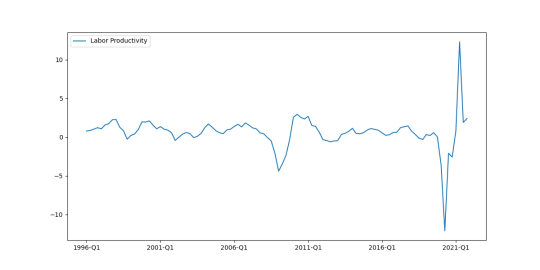
Finally, let us do the labor productivity for the Euro area:
dataset = 'MNA/Q.Y.I8.W0.S1.S1._Z.LPR_PS._Z._T._Z.EUR.LR.GY'
df = ecbProbe(dataset,'Labor Productivity',14)

df.plot(figsize=(12,6))
plt.savefig('ecb-with-python-labor-productivity.png')