ECB Data with Clojure and Vega-Lite
Description of the problem
I have been exploring ECB data through their API. I have done python, scala and common lisp before. Now, it is clojure’s turn.
The code
Let us start with the namespace and deps.edn. This is
what I have for the deps.edn:
{:deps {org.clojure/data.json {:mvn/version "1.0.0"}
        clj-http/clj-http {:mvn/version "3.10.1"}
        metasoarous/oz {:mvn/version "1.6.0-alpha6"}}
}
which I use in the ns
(ns ecb
  (:require [clojure.data.json :as json]
            [clj-http.client :as client]
            [oz.core :as oz]))
I need data.json
for JSON parsing, clj-http for
the http client, oz for vega-lite
visualization.
The code snippet below, queries ECB data repository. The hard part is to figure out the ECB’s designation for the dataset one needs to query.
(defn request [dataset]
(let [raw (-> (str "https://sdw-wsrest.ecb.europa.eu/service/data/ECB," dataset)
(client/get {:accept :json})
:body
json/read-str)
dates (map (fn [k] (get k "name"))
(-> raw
(get "structure")
(get "dimensions")
(get "observation")
first
(get "values")))
values (-> raw
(get "dataSets")
first
(get "series")
vals
first
(get "observations"))]
(->> (into [] values)
(mapcat (fn [[k v]]
{(nth dates (read-string k)) (first v)}))
(into {}))))
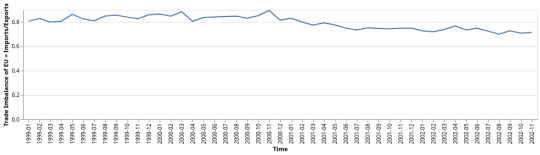
#'ecb/requestThe function below queries the ECB data server for European total imports and exports to a specific country to calculate the trade imbalance over time, and then plots the result via vega-lite library oz.
(defn experiment [country]
  (let [imports (request (str "TRD/M.I8.Y.M.TTT." country ".4.VAL"))
        exports (request (str "TRD/M.I8.Y.X.TTT." country ".4.VAL"))
        data (map (fn [k] {:date k
                           :value (/ (get imports k) (get exports k))})
                  (keys imports))
        plot {:data {:values data}
              :encoding {:x {:field :date :type "nominal" :title "Time"}
                         :y {:field :value :type "quantitative" :title "Trade Imbalance of EU = Imports/Exports"}}
              :mark "line"}]
    (oz/view! plot :port 12345)))

#'ecb/experiment
Let us run this for Great Britain: If you run this on your machine, the visualization you will get from oz on your browser is better than the PNG I am including here.
(oz/start-server! 12345)
(experiment "GB")