Working with European Central Bank Data in Python
Description of the problem
This is my third in my series of working with econometric data queried from a specific data store using a specific API. Today, I am going to work with European Central Bank’s datasets using their API. My language of choice today is going to be python.
Implementation
ECB serves its data in XML format. Python has an
excellent library called xmldict that
converts an XML object into a python hash map (dictionary in python
parlance.) First, let us load the libraries we are going to need.
from urllib.request import urlopen
from xmltodict import parse
Here is the query function. One needs to poke around the hashmap a while to figure out how to extract the relevant bits. It is ugly, to say the least. I am sure ECB has its own reasons for structuring the response this way, but it eludes me.
def QueryECB(series):
with urlopen("https://sdw-wsrest.ecb.europa.eu/service/data/EXR/" + series) as url:
raw = parse(url.read().decode('utf8'))
data = raw['message:GenericData']['message:DataSet']['generic:Series']['generic:Obs']
res = {x['generic:ObsDimension']['@value']:
float(x['generic:ObsValue']['@value'])
for x in data}
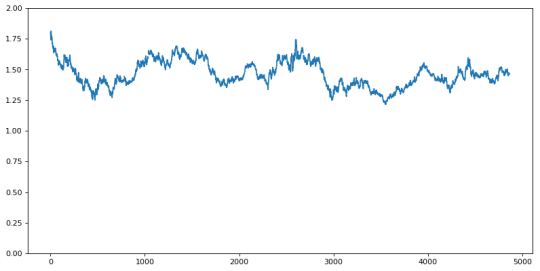
return resAs an example, I am going to query Euro (EUR) and Canadian Dollar (CAD) daily exchange rate:
res = QueryECB("D.CAD.EUR.SP00.A")You should poke around this data too. As this is Sunday, and I am still waking up, I am going to just draw it:
import matplotlib.pyplot as plt

dates = res.keys()
xs = list(range(len(dates)))
ys = [res[x] for x in sorted(dates)]

plt.figure(figsize=(12, 6), dpi=80)
plt.ylim(0.0, 2.0)

plt.plot(xs,ys)
plt.show()