Polarization in the US Congress
I realized that I haven’t posted anything on data analysis lately, or something with python. When I found that Civic Impulse has been collecting data on voting records of the US Congress, I thought I would type up something.
Decription of the problem
Polarization of the Congress and the Senate has been described as a big problem in the US politics. Could we actually see or quantify this polarization from the voting behaviours of the US Congress?
Data analysis
First, I am going to need some libraries:
 import glob as g
 import json
I downloaded data from govTrack.us. I arranged the data in directories separated by years.
First, I will define a function that will process the data
 def process(year):
   data = {}
   bills = g.glob(str(year)+'/h*')
   for x in bills:
      with open(x+'/data.json') as input:
         raw = json.load(input)
      if(raw[u'category'] == u'passage'):
         data.update({x: raw[u'votes']})
   return(data)
I will extract ’Yea’s and ’Nay’s as follows:
 def extract(data):
   z = ['y','n','x']
   votes = {}
   for x in data.keys():
      try:
         data[x][u'Aye']
         y = ['Aye','No','Not Voting']
      except:
         y = ['Yea','Nay','Not Voting']
      res = {}
      for i in range(3):
         temp = {u'D':0, u'R':0, u'I':0}
         for j in data[x][y[i]]:
            temp[j[u'party']]+=1
         res.update({z[i]: temp})
      votes.update({x: res})
   return(votes)
And finally a function that calculates polarization. I used the following idea: if \(a\) and \(b\) are Democrats and Republicans on an issue voting a particular way then I will say the polarization is \(\frac{\|a-b\|}{a+b}\). Then I will sum up these values for Yea’s and Nay’s.
The following function returns the percentage of bipartisan bills from a given year’s voting data. I will consider a specific voting bipartisan if the polarization measure is less than or equal to 0.5.
 def polarization(votes):
   result = 0
   for x in votes.keys():
      local = votes[x]
      measure  = abs(local['y']['D']-local['y']['R'])
      measure += abs(local['n']['D']-local['n']['R'])
      measure += abs(local['x']['D']-local['x']['R'])

      total = 0
      for k in ['y','n','x']:
         for l in ['D','R','I']:
            total += local[k][l]

      measure /= (1.0*total)

      if(measure<=0.5):
        result+=1

   return(100.0*result/len(votes))
Let us run this over our data:
| Year | Percent |
|---|---|
| 1990 | 61.38 |
| 1991 | 59.06 |
| 1992 | 47.40 |
| 1993 | 24.29 |
| 1994 | 40.83 |
| 1995 | 37.63 |
| 1996 | 48.74 |
| 1997 | 53.24 |
| 1998 | 45.58 |
| 1999 | 50.61 |
| 2000 | 58.44 |
| 2001 | 54.96 |
| 2002 | 50.00 |
| 2003 | 44.52 |
| 2004 | 50.00 |
| 2005 | 46.10 |
| 2006 | 33.33 |
| 2007 | 20.52 |
| 2008 | 15.33 |
| 2009 | 10.12 |
| 2010 | 10.16 |
| 2011 | 14.62 |
| 2012 | 12.38 |
| 2013 | 11.63 |
| 2014 | 17.05 |
Here is the plot of the data:
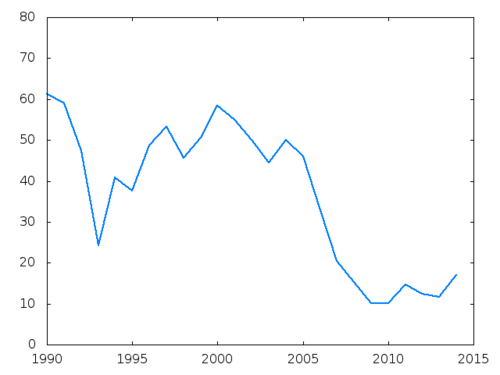
Analysis
Something must happened in 1993. My guess is that prior to 1994 when the Republicans gained control of both chambers first time in the last 40 years, the tensions in the Congress must have been high. But of course, this is a wild guess. I am not a political scientist. One can also see that the situation got worse during the second term of Bush the Second, and has not improved since.