Distribution of Collatz Lengths (continued)
This is a continuation of my previous post on Collatz Lengths.
Description of the problem
Let me start by repeating the function that I would like to change a bit. Originally I had \[ f(n) = \begin{cases} n/2 & \text{ if $n$ is even }\\ 1 & \text{ if $n=1$ }\\ 3n+1 & \text{ if $n\neq 1$ is odd } \end{cases} \] I used this function to define a recursive sequence \(a_{n+1} = f(a_n)\). And the question was to show that this sequence eventually produces \(1\) for any initial natural number value \(a_0\).
For a prime number \(p\) and a natural number \(n\), the \(p\)-part of \(n\) is \(\nu_p(n)\) the largest natural number \(m\) such that \(p^m\) divides \(n\).
Now, notice that the recursive sequence gradually destroys the 2-part of any initial value first, then applies the function \(3x+1\), and it repeats the procedure until it hits \(1\). This is where we stop.
Let me concentrate on the crucial part then. I will redefine \(f(n)\) as follows: \[ f(n) = \begin{cases} f(n/2) & \text{ if $n$ is even }\\ 1 & \text{ if $n=1$ }\\ 3n+1 & \text{ if $n\neq 1$ and it is odd } \end{cases} \] Again define a recursive sequence \(a_{n+1} = f(a_n)\), and let \(iter(a)\) be the length of the recursive sequence \((a_n)\) for \(a_0 = a\).
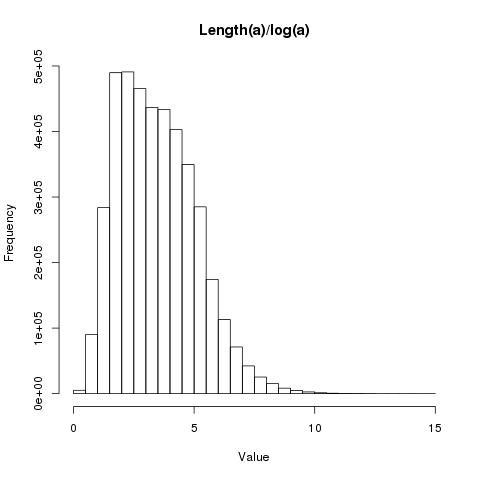
Today, I would like to look the distribution of \(iter(n)/log(n)\).
The lisp code
First, our basic function
(defun f(n)
   (cond ((evenp n) (f (/ n 2)))
         ((= n 1) 1)
         (t (1+ (* 3 n)))))
F
Our iteration:
(defvar upper-limit (expt 2 22))

(defun iterate (n &optional (k 0))
   (if (= n 1)
      k
      (iterate (f n) (1+ k))))
ITERATE
OK. Let me run the code.
(with-open-file (results "collatz3.csv"
                         :direction :output
                         :if-exists :supersede
                         :if-does-not-exist :create)
                (loop for i from 2 to upper-limit
                      do (format results "~A ~A~%" i (/ (iterate i) (log i)))))
NIL
Here is the plot of the results (\(n\) versus \(len(n)/log(n)\)):
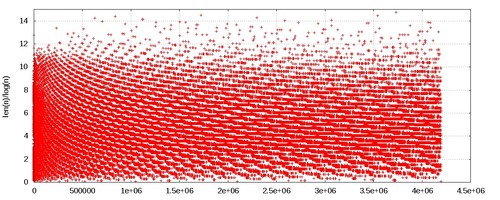
It is difficult to understand what is going on here. Let me consider the first 20000 values only:
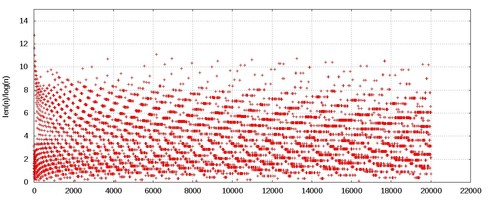
And now for the last 20000 values:
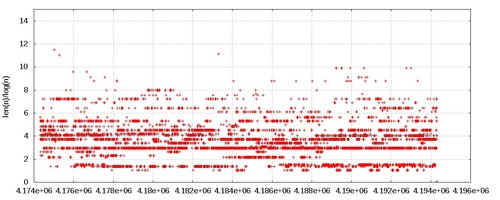
X <- read.csv("collatz3.csv",sep=" ",header=FALSE)

png(filename="collatz3-histogram.png")
hist(X$V2,main="Length(a)/log(a)",xlab="Value")
dev.off()
The distribution of the results is as follows: